Thursday 18 October 2012

Labour relations: The Japanese approach to management – is it under threat?


The Japanese labour market is characterised by the lifetime employment system, seniority-based wages, and labour dualism. As this article will show, there is no evidence that the system of lifetime employment will change in the near future, although there is progress in the field of payment systems. Since Japan is facing the rapid ageing of its population and labour force changes must be made in Japan in order to maintain the strong competitive position in the global economy.  
This article consists of four parts. The first part provides an insight into Japan’s population and labour force. The second and the third part describe the functioning of Japanese labour markets. Final remarks explaining why Japanese labour practices are under a threat is set out in the conclusion.

JAPAN’S POPULATION AND LABOUR FORCE
Japan's population was growing continuously for almost four decades, but in 2010 Japan’s population fell to the 2000 level, as showed in Figure 1. The population is expected to fall in the long run as the falling birth-rate and the aging population change the population composition (Statistics Bureau, 2011). Expectations are that by 2050 the Japan’s population will fall by 25 million people. Between 1970 and 2000, as Japan’s population grew, its labour force  also increased. Thereafter the number of employed people started to fall and the unemployment rate increased and in 2010 it reached 5.1 per cent, still representing a very low unemployment rate relative to other developed countries . Throughout the observed period, almost half the population was employed. The reasons for the low unemployment rates are mainly attributable to the lifetime employment system, minimum wage laws, unemployment compensation and the demographic structure of the labour force (Flath, 2005).  


Labour force (in 000)

Year
Population (in 000)
Employed
Unemployed
Unemployment rate (%)

1970
104,665
55,094
590
1.1
1980
116,794
55,360
1,140
2.0
1990
123,191
62,490
1,340
2.1
2000
126,706
64,460
3,200
4.7
2005
127,449
63,560
2,940
4.4
2010
126,995
62,570
3,340
5.1
(2025)
(120,793)
-
-
-
(2050)
(101,659)
-
-
-


Figure 1: Japan’s population and labour force
Source: The Japan Institute for Labour Policy and Training (2011)  

Figure 2 shows the labour force participation rate  by age group for both men and women in 1975 and 2009. The proportion  of men who are members of the labour force are similar in each year, where the participation rate of men aged between 25 and 55 was over  95 per cent. The situation is different when considering the women’s participation rate. Even though the percentage of young women aged between 15 and 24, has not changed throughout the period, there is a significant change of participation rate of women aged 25 to 64. The percentage of women in the labour force increased, with respective percentage in the age group 24-29 increasing by 35 per cent, and other age groups experienced the change of 6 up to 14 per cent, but the percentage remained almost the same for women aged 65. In 1975 and 2009 the curves are shaped as a letter M and they indicate that women leave the labour force when they are starting a family and re-join the labour force after the burden of child-rearing is reduced (Statistic Bureau, 2011). The advance of technology and improved educational status of women have increased women’s labour productivity and therefore resulted in a greater participation rate (Flath, 2005).  Women who follow this pattern are not included in lifetime employment system of large companies (Flath, 2005).
Figure 2: Labour force participation rate by sex and age group
Source: The Japan Institute for Labour Policy and Training 


The largest proportion of Japanese women is in clerical and related jobs and in the protective and other services, where they account for over 50 per cent of the labour force in both 1980 and 2010.  As shown in Figure 3, the proportion of female workers has consistently been very low in the transport and communication sector over the past 30 years. Women are also rarely employed as managers and officials, but they improved their status over the period. In general, Japanese women are not well-educated or career-minded and they earn substantially less than Japanese men (Flath, 2005) which can explain the small proportion of women as managers or similar occupations. 

Figure 3: Percentage of female workers by occupation
Source: Statistical Handbook of Japan 2011 by Statistics Bureau


In the 40-year period the Japanese structure of employment has changed, hence the ratios of primary and secondary industries fell and tertiary industry rose and it is the main sector industry in Japan.  More than 70 per cent of people are employed in the service industry . 

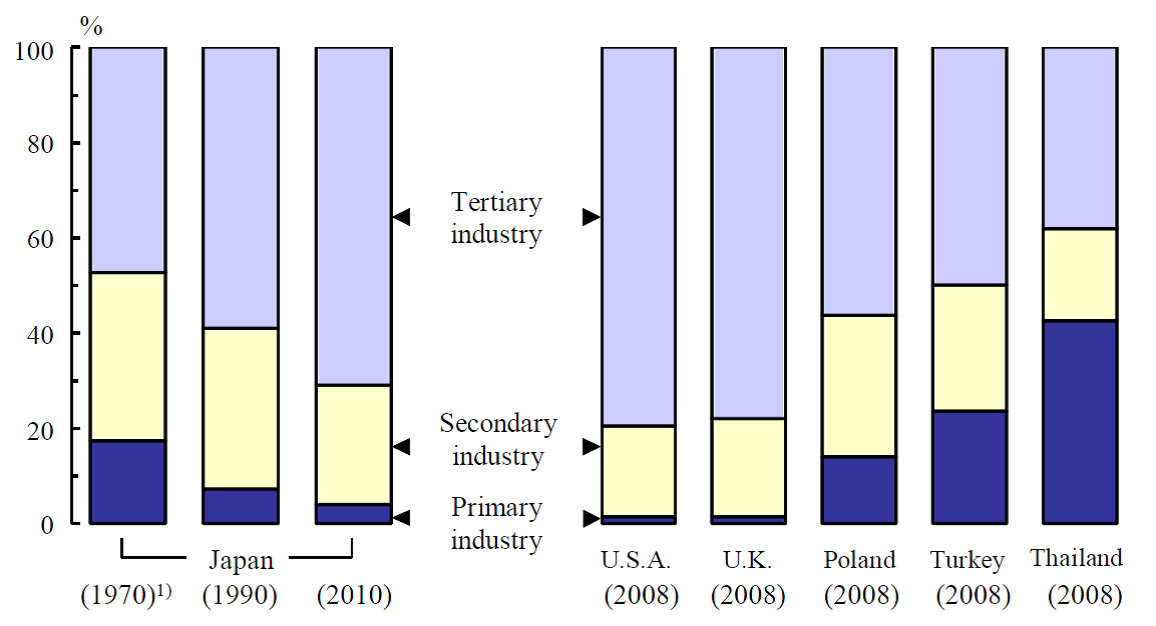
Figure 4: Structure of employment by country
Source: Statistical Handbook of Japan 2011 by Statistics Bureau


The Japanese employment structure nowadays is quite similar to the UK’s and the USA’s structure. This is not surprising since Japan, the UK and the USA are developed countries which are heavily weighted towards the service sector; in contrast, industries such as manufacturing and agriculture are the main industries for developing and emerging countries like Turkey, Thailand and of course China  . 
Since developing countries have a cheaper production (e.g. low cost labour, economies of scale) there is a big possibility that Japan will transfer its remained production and manufacturing plants to those countries in order to achieve global competitive advantages and at that time the ratio of primary and secondary industry will be even smaller. This can lead to the changes of the lifetime employment and payment systems in Japan.

PAYMENT SYSTEMS IN JAPAN
Japanese people during their lives rarely change their jobs and employers and receive a larger component of pay based strictly on the number of years of continual service, which represents the pattern of lifetime employment and seniority-based wages (Flath, 2005). The argument for seniority-based wage nenko system is that workers with more years of formal education and with longer experience in occupation have more skills and contribute more to the output and revenues of their employers; hence their services are in greater demand. In that case, the earnings of workers that possess skills will remain above those of workers who lack them. This system is used to control and motivate the employees of large companies. Furthermore, it discourages quits and increases the onerousness of early dismissal and has enabled large Japanese companies to economize on the costs of training employees in skills that are specific to their respective work-places, while preserving employee incentives to exert effort (Flath, 2005). 
Rebick (2001) argues that the seniority-based wage system was common in the 1950s, but through the 1960s and 1970s almost all large companies adopted shokuno-shikaku seido or in other words, the ability-qualification wage payment system. In this system, workers are primarily paid according to the qualifications that they receive for developing skills but there are still some links to seniority in this payment system. Nowadays, many companies are moving away from the ability-qualification wage payment system by imposing the new payment system based on the ability shown through actual performance on the job. Due to a limited number of managerial positions, companies are more interested in the development of specialist skills through which workers can demonstrate their abilities. 
A widespread practice in Japan is to reward workers by giving them bonuses twice a year and those bonuses are not given just to the senior executives, but also to any other employee, which is not the case in the USA (Flath, 2005). Moreover, bonuses account for a large proportion of overall annual earnings and they are not linked to individual performance but reflect the wider performance of the company.

LIFETIME EMPLOYMENT, LABOUR MOBILITY AND ENTERPRISE UNIONS
Kato (2000) describes the practice of lifetime employment as an indispensible ingredient of successful Japanese management. The lifetime employment system is related to the fact that Japanese companies avoid dismissals in order to protect their investment in training employees (Flath, 2005).  Under this practice, an employee is hired by a company immediately after school graduation, receives training on the job, and remains with the same company until his retirement (Raisan and Hashimoto, 1985) or the employee changes fewer companies over his lifetime (Flath, 2005). A long-term employment relationship is a principal reason for Japan's high labour productivity (Raisan and Hashimoto, 1985). 
The lifetime employment resulted in lower labour mobility in Japan. Surveys demonstrate that this system has not changed over the years. Kato (2000) in his survey presented quantitative evidence on changes in the prevalence of lifetime employment from the 1980s to the 1990s. He found little evidence of decline in lifetime employment and confirmed that the practice of lifetime employment applies only to men and that long-term employment is more prevalent in Japan than in the USA, as shown in the Figure 5. Between the 1980s and 1990s 55.22% of Japanese male employees, aged 20-24  with more than 5 years of tenure, retained the same job 15 years later but only 28.45% did so in the USA. Each age group shows similar results, whereby Japan has considerably higher retention rates than the USA. 

1982 (1983)
Japan (1982 – 97)
U.S. (1983 – 98)
Age
Tenure (years)
15 – year retention rate (%)
15 – 19
0 – 4
39.99
4.59
20 – 24
0 – 4
5 +
51.08
55.22
13.92
28.45
25 – 34
0 – 4
5 +
52.24
73.64
20.13
48.14
35 – 39 (35 – 44)
0 – 4
5 +
46.65
78.44
22.06
52.14
Figure 5: Fifteen-year job retention rates of male employees in Japan and the United States
Source: Kato 2000

In 2011 Japan’s Statistic Bureau and Kosugi  carried out a similar survey on labour’s mobility in Japan, both showing the low labour mobility in this decade. Labour dualism is a characteristic of Japanese labour market which is divided into regular or permanent workers and non-regular or temporary workers (OECD, 2011).  
Figure 6 shows there were 51.11 million employees of whom 65.7 per cent were regular staff members in 2010. The ratio of regular staff members among all male employees was 81.1%, while the corresponding ratio for females was 46.2%, which is consistent with Kato’s (2000) survey. Women are mostly temporary workers while men are regular staff members. 

(in 000)

Employees*
Regular staff
Percentage
Non– regular staff
Total
51,110
33,550
65.7
17,550
Males
28,480
23,090
81.1
5,390
Females
22,630
10,460
46.2
12,180
*Excluding company executives.
Figure 6: Employment by employment pattern (2010)
Source: Statistical Handbook of Japan 2011 by Statistics Bureau

Kosugi’s recent study showed that only 13.9% employees changed their status, from non-regular to regular. Regular workers represent 75% of men and only 34.9 % of women, hence women are mostly hired as temporary workers and they rarely make the transition to permanent status, which demonstrates the strong position of men in Japan.  Since the transition rate from non-regular to regular status is low, a worker who accepts non-regular employment faces a high probability of never escaping this category, with its accompanying low wages, reduced training, precarious jobs and limited social insurance coverage (OECD, 2011).

Survey of 4000 workers between the ages 25 and 44 (Kosugi,2010), in %
Men
Women
Total
Regular workers
75.0
34.9
58.4
Workers hired directly from school who maintain regular status
30.9
13.5
23.7
Workers who changed jobs while maintaining regular status
17.7
3.7
11.9
Non – regular workers who became regular workers in a different firm
11.5
9.6
10.7
Non – regular workers who became regular workers in the same firm
3.6
2.5
3.2
Workers who were self-employed or voluntarily unemployed
11.3
5.7
9.0
Non regular workers
8.6
53.8
27.3
Workers with experience as regular workers
1.3
7.4
3.8
Workers who have remained non-regular workers
3.9
31.1
15.2
Self-employed executives and family workers
16.4
11.4
14.3
Workers with experience changing from non-regular to regular status
1.7
1.1
1.5
Figure 7: Employees by past employment history
Source: OECD 2011

Japan, as many other countries, also has labour unions but most Japanese unions are enterprise unions which collect the employees of a single firm, not the whole industry (Flath, 2005). In Japan, enterprise unions account for more than 90 per cent of all unions and organized workers (Jeong, Aguliera, 2008). The prevalent members of enterprise unions are regular workers of large manufacturing company. Therefore, union members are workers employed in the system of the lifetime employment and seniority-based wages (Flath, 2005), which means that non-regular workers, mostly women are in disadvantageous situation. The enterprise unions utilize negotiations and labour-management consultations to improve working conditions, to monitor corporate activities, and to provide services to their members . 
Jeong and Aguliera (2008) see the enterprise unionism in Japan as a result of labour’s failure in institutionalizing horizontal unions where state and management played a huge role in defeating the horizontal and industrial unionism which were seen as the threats to the government and large companies. 

CONCLUSION 
Traditional Japanese labour market practices, such as the lifetime employment, seniority-based wage system and labour dualism are no longer appropriate since Japan’s economic growth is low, the population is ageing, unemployment rising and globalisation shifted the balance of power which has dented Japan’s long term competitive advantage. Due to globalisation many companies in developed countries have transferred their production and manufacturing plants to developing and emerging markets since production is cheaper there and in that way they can cope in increasingly competitive markets. Japan is expected to do the same. Because of that the ratio of primary and secondary industry will reduce and Japan will need to re-educate part of its workers so they are able to work in the service sector. All this can lead to the changes of the lifetime employment and payment systems in Japan. Labour market dualism must be revised for the same reason and economic policy and management attitudes must adapt in order for Japan to cope in an increasingly competitive environment. Low labour mobility, lifetime employment and nenko system mean lower competition between workers and these practices can reduce the incentive to work hard for the company.  Since the population of Japan is rapidly aging, they should draw more women into the labour force, but in order to do that, sex discrimination must be addressed. Women should be able to work and raise a family at the same and this can foster population growth. Furthermore, Japan should invest more in the education of women and they need to be paid at the same rate as men so women can become career-minded workers.

References
1. Blomstrom, M., Ganges, B., & Croix, S., (2001) Japan’s New Economy: Continuity and change in the twenty - first century. New York: Oxford University Press.
2. Flath, D., (2005) The Japanese economy, 2nd Edition. New York: Oxford University Press.
3. Hashimoto, M., Raisan, J. (1985) Employment Tenure and Earnings Profiles in Japan and the United States. The American Economic Review, 75 (4) pp. 721-735
4. Jeong, D.Y., Aguliera, R.V. (2008). The Evolution of Enterprise Unionism in Japan: A Socio-Political Perspective. British Journal of Industrial Relations 46 (1), pp. 98-132
5. Kato, T., (2000) The end of lifetime employment in Japan? Evidence from National Surveys and Field Research, Journal of the Japanese and International Economies, 15, pp. 489-514.
6. Naughton, B. (2007) the Chinese Economy: Transitions and Growth. Cambridge: MIT
7. OECD Economic Surveys: Japan [online]. Available at: http://www.keepeek.com/Digital-Asset-Management/oecd/economics/oecd-economic-surveys-japan-2011/labour-market-reforms-to-improve-growth-and-equity_eco_surveys-jpn-2011-8-en
8. The Japan Institute for Labour Policy and Training [online]. Available at: http://www.jil.go.jp/english/estatis/databook/2011/02.html
The Statistics Bureau and the Director-General for Policy Planning of Japan [online]. Available at: www.stat.go.jp 

Wednesday 17 October 2012

Debt crisis in Greece - are there lessons to be learnt from the Latin American case?


Recently there have been many debates about the Greek crisis, its causes and potential consequences. With Greece being a member of the European Monetary Union many other countries depend on the situation in Greece. In order to know how to prevent Greece’s default and the potential meltdown of the European financial system there is a need to understand the history and origins of Greece’s debt crisis. As I will attempt to illustrate in this article at the core of the current crisis are fundamental imbalances in the level of consumption and income, which following years of reckless behaviour, brought the European integration project to its knees. 
In order to explain the origins of the crisis and provide a basis for the formation of an effective resolution, many lessons can be learned from past debt crises with a view to avoid taking the wrong policy decisions and efficiently work toward the restoration of confidence in sovereign bond and financial markets. I will therefore take a comparative approach and consider the parallels between the Latin American debt crisis of the nineteen eighties and the current debt crisis in Greece.
As this article will set out, while in both the Latin American (1980s) and Greek (late 2000s) case the trigger was an external shock, the key difference between the two is the structure of the total public debt. While Latin American countries affected by the crisis were characterised by a high proportion of short term debt in the total public debt, Greek was characterised by an overall high level of indebtedness, particularly external debt, accumulated over years of excess consumption with limited long term investment.    
This article will discuss the differences and similarities of crisis in Greece today and debt crisis in Latin America during the 1980 by analysing key economic indicators. Firstly, I will summarize the beginning of the debt crisis in Latin America (focusing on Argentina, Brazil, Venezuela, and Mexico) and Greece and then compare their respective public debt levels, inflation rates and Gross Domestic Product.  

THE BEGINNING OF THE DEBT CRISES IN LATIN AMERICA AND GREECE
As Montiel (2003) pointed out, the problems for Latin American countries started in the 1970s when international inflation was high and nominal interests were relatively low and developing countries experienced rapid growth. These circumstances allowed the Latin American governments to borrow heavily and they accumulated a sizable stock of external debit by the beginning of the eighties. At the very end of the seventies the situation changed rapidly as oil prices increased and consequently in the early 1980s interest rates raised sharply which resulted in developing countries’ growth slowing down. With falling growth Latin American countries had problems in meeting their obligations and making interest repayments (El-Gamal et al, 2009). 
The financial crisis that started in the USA in 2007 and spread all over the world has not bypassed Greece. Even though almost every developed country has had heavy problems in resolving the crisis, Greece’s problems were even deeper and date back before 2007; the Greek government’s weak co-ordination and organization, high expenditures in comparison to revenues, corruption, tax evasion, weak welfare system and inflexible employment laws (Muhammad et al, 2011). Before entering the Eurozone, Greece needed to satisfy the criteria  set out in the Maastricht Treaty in order to adopt euro as its own currency. Greece entered the Eurozone on 1 January, 2001 and by becoming a member of European Monetary Union (EMU) funds started to flow into the country, mainly German funds (Arghyrou and Tsoukalas, 2010). Markets perceived that the EMU countries had a vested interest in Greek reforms and Greece’s continued participation in the EMU (Arghyrou and Tsoukalas, 2010). After 8 years of entering the Eurozone it surfaced that Greece lied about its circumstances by misrepresenting its monetary and fiscal results (Muhammad et al, 2011). The reason behind the Greece crisis was the behaviour of its institutions, as they behaved dysfunctional which was neither forecasted nor expected (Muhammad et al, 2011).
Latin American countries in the 1980s and Greece today have a common feature high external debt and both Latin America and Greece depended on the economic situation in foreign countries, specifically on the credit inflows from these countries.


PUBLIC DEBT AND GOVERNMENTS’ EXPENDITURES

During the 1980s the largest Latin America debtors were Argentina, Brazil, Mexico and Venezuela (Guidotti and Kummar, 1991) and in Europe today one of the largest debtors is Greece, followed by Portugal, Ireland, Spain and Italy (The Economist, 23 April 2011). This section will compare available data about public debts and governments’ expenditures within the countries and will illustrate how healthy these economies were over the observed period. 
Argentina, Brazil, Mexico and Venezuela accumulated their public debt over the years. Graph 1 shows their total and external debt as percentage of GDP between 1976 and 1988.  From the graph is visible that there was a constant growth of total debt till the 1987 when total debt started slightly to decrease. The culmination of public debt was in 1986 when it was more than 50 per cent of GDP and external debt was more than 30 % of GDP. From 1976 external borrowing grew steadily till the 1986 when it finally started to decline.


Graph 1: Total public debt and external public debt for Four Largest Debtors, 1976-88 (percentage of GDP)
Source: Guidotti and Kummar (1991)

A key characteristic in the management of public debt is the debt maturity where long-term debts (bonds) are desirable since they help in stabilizing inflation and prevent “credibility  crises” (Guidotti and Kummar, 1991). The debt structure of Latin American during the 1980s was heavily geared towards short term debt, as set out in the table below.


Short-Term Debt/Total Debt
Country
1982-1988
1987-1988
Argentina
63.3
73.7
Brazil
100.0
100.0
Chile
48.3
31.8
Mexico
73.8
71.8
Table 1: Debt Maturities, 1982-88 and 1987-88 (in per cent)
Source: Guidotti and Kummar (1991)

Brazil’s total debt fully consisted of short-term debt while over 50 per cent of total debt was short-term debt in Mexico and Argentina. The reasons for that structure probably lay in the lack of credibility of Latin countries which prevented them from issuing long-term bonds (Guidotti and Kummar, 1991). The exception was Chile which had less than 50 per cent of short-term debt. 
As for Greece, it most recently became obvious that Greece lived far beyond its means as illustrated in graphs 2 and 3. Government consumption consistently exceeded total government revenue. Most strikingly, the gap between expenditures and revenues widened in 2009 due to the sharp drop in economic activity and private sector demand. From 2000 Greece’s government expenditures were constantly higher than revenues and in 2009 expenditures reached over 50 per cent of the GDP. The year 2009 was the year when the Greek crisis exploded, when its credibility was shifted down and when it was placed very high for the corruption (Muhammad et al, 2011).

Graph 2: General government revenues and expenditures, 2000-2010 (as percentage of GDP)
Source: IMF, World Economic Outlook Database, September 2011


At the time of joining EMU, in 2001, Greece’s debt-to-GDP ratio was over 100 %, and it means that Greece could not have met one of the Maastricht Treaty criteria, whereas the debt-to-GDP ratio needed to be below 60%. In the following four years there was a slight decrease of debt, it even fall below 100 %, but in 2006 it exceeded the percentage in 2000 and 2001. From 2006 there is a constant rise of debt and from 2008 it sharply increased. By the end of last year 80% of Greek debt was being held abroad (Muhammad et al, 2011).

Graph 3: General government gross debt , 2000-2010 (as percentage of GDP)
Source: IMF, World Economic Outlook Database, September 2011


INFLATION 
Since Latin American countries had a problem with insolvency, their central banks started to print money in order to be able to repay the debts and one of the consequences was a high inflation (Montiel, 2003). This had the effect of pushing up inflation rapidly over a short period of time. The graph below illustrates the rate of inflation during the 1980s in major Latin American countries. 


1980
1981
1982
1983
1984
1985
1986
1987
1988
1989
Argentina
100.76
104.48
164.78
343.80
626.73
672.18
90.09
131.34
342.95
3079.46
Brazil
90.22
101.73
100.54
135.03
192.12
225.99
147.14
228.34
629.12
1430.72
Mexico
26.47
27.95
59.15
101.86
65.44
57.75
86.39
131.90
113.66
19.94
Venezuela
21.36
16.24
9.61
6.24
12.25
11.38
11.54
28.14
29.47
84.46
Table 2: Inflation (average consumer prices), Four Largest Latin American Debtors, 1980-1989
Source: IMF, World Economic Outlook Database, September 2011

Graph 4: Inflation rates, 1980-1989
Source: IMF, World Economic Outlook Database, September 2011


Argentina and Brazil suffered from hyperinflation. In 1989 Brazil’s inflation reached more than 1400% and Argentina’s was even higher, at an extraordinary 3079%.  Mexico’s highest rate of inflation was in 1987 when it reached 132%, while Venezuela experienced high inflation at the very end of the eighties. 
In contrast, Greece did not suffer from hyperinflation and its inflation rates ranged between 1.3 and 4.7 % over the last ten years, as shown in the graph 5. Even though that Greece’s inflation rate were not so high, they were constantly higher that the EMU average. After world finical crisis attack, both Greece and EMU countries experienced a sharp fall of inflation but for very short period of time. From 2009 the inflation rates are rising.

Graph 5: Inflation rates (Consumer prices), 2000-2010, Eurozone countries and Greece
Source: IMF, World Economic Outlook Database, September 2011


GROSS DOMESTIC PRODUCT
Another proof of the “lost decade” (phrase which refers to the experience where countries had lower GDP at the end of the decade than at the beginning; Montiel, 2003) is seen in the graph below which shows the volatility of GDP of four largest debtors during the eighties. Four largest debtors, Argentina, Brazil, Venezuela and Mexico experienced instability, their GDP fall and rose with no particular order and each year brought different outcome.

Graph 6: Gross Domestic Product for Four Largest Debtors, Constant Prices, 1980-1989 
Source: IMF, World Economic Outlook Database, September 2011


In contrast, Greece’s GDP was relatively more moderately volatile between 2000 and 2010,  in fact till 2008 Greece’s GDP growth was constantly positive, with minor falls in the growth rate between 2000 and 2002, 2003 and 2005. However, when the global financial crisis reached its peak in later 2008/2009, Greece’s GDP fell dramatically indicating severe recession in Greece.

Graph 7: Gross Domestic Product, Greece, 2000-2010 
Source: IMF, World Economic Outlook Database, September 2011


OUTCOMES AND CONCLUDING REMARKS
In both the Latin American (1980s) and Greek (late 2000s) case the trigger for debt crisis was an external shock, yet this is the only thing they have in common. Latin American countries in 1980s were developing countries and they were not in monetary union and Greece today is developed country and it is in the monetary union.  Taking this into consideration it can be easily assumed that their economic indicators are not the same, not even similar. There is difference in the structure of the total public debt. While Latin American countries affected by the crisis were characterised by a high proportion of short term debt in the total public debt, Greek was characterised by an overall high level of indebtedness, particularly external debt. Inflation trends in case of Latin America were significantly different from Greece’s inflation; Latin American countries in the 1980s experienced inflation from 6% to extraordinary 3049% (at the end of the decade) and Greece’s inflation was not even close to these figures, but its inflation was constantly higher than EMU countries average.   Gross Domestic Product of the Latin American countries in 1980s was instable and each year had a different outcome, while Greece’s GDP was relatively stable over time. However, when the global financial crisis reached its peak, Greece’s GDP fell dramatically indicating severe recession in Greece.
There were few attempts for reducing the debt crisis in Latin America. In the mid-eighties the USA announced the Baker Plan, a programme designed to partially restore flows of commercial credits (Pastor, 1993). When this plan had almost no success, in 1989 the USA suggested a new approach, the Brody Plan which was based on rewarding more conservative regimes with partial debt relief where International Monetary Fund and World Bank agreed to offer resources to back debt-reduction programmes for countries with viable economic programmes (Rhode, 1992).  The Brody Plan at the end resolved the debt crisis.
The global financial crisis that started in 2007 was just further exacerbated by the Eurozone sovereign debt crisis. The uncertainty caused by the recklessness of Greece has prompted the two largest Eurozone economies, Germany and France to take the lead and try to figure out how to best help Greece and prevent a total collapse of the region’s economic and financial system (Muhammad et al, 2011). The EU, IMF and ECB (“Troika”) have provided Greece with loans in order cover its budget deficit without default. In May 2010 agreement was reached between International Monetary Fund, euro area members and Greece about 110 billion euro heavy package. On 21 February 2012, EU Member States agreed to a new 100 billion euro loan and in exchange Greek government is forced to impose strict fiscal austerity which makes Greeks angry. Reasonable, cuts are indeed painful.
However, is it possible to resolve the debt crisis in Greece and make everybody happy? It appears that no one knows for sure. Some think that the Brody Plan can be a good solution for Greece (and the Eurozone) and others think that the only solution for Greek survival is leaving the Eurozone.  Some go even further; Greece should be left to default.
It is known how and when Latin American debt crisis ended up, but it is difficult to say for how long  the “Greek tragedy” will last.


REFERENCES
1. Arghyrou, M. G., Tsoukalas, J.D., (2010) “The Greek Debt Crisis: Likely Causes, Mechanics and Outcomes”. Cardiff Business School Working Paper Series. [online] Available at: http://business.cardiff.ac.uk/sites/default/files/E2010_3.pdf 
2. Baskaran T. (2009). Did the Maastricht Treaty Matter for Macroeconomic Performance? A difference-in-difference investigation. KYKLOS, 62(3), pp. 331–358 [online] Available at: JSTOR 
3. Economist Intelligence Unit (2010) Greece Country Report [online], Available at: Business Source Premier 
4. Economist Intelligence Unit (2011) Greece Country Report [online], Available at: Business Source Premier 
5. El-Gamal , M. A. and  Jaffe, A.M. (2010) . Oil, Dollars, Debt and Crisis: The Global Curse of Black Gold. New York: Cambridge University Press, pp. 97-116.
6. Guidotti, P., Kumar, M. (1991). Domestic Public Dept of the Externally Indebted Countries. Occasional Paper 80. IMF
7. IMF (2011), World Economic Outlook Database - September 2011, [online] Available at:
http://www.imf.org/external/pubs/ft/weo/2011/02/weodata/index.aspx  
8. Latin lessons: There is a model for how to restructure Greece debts (2011). The Economist; 398 (8730),  pp. 16-18 [online]. Available at: Business Source Premier 
9. Montiel, P. (2003). Macroeconomics in Emerging Markets. E-book edition. [online] Available at: Dawsonera. 
10. Muhammad, A., Liaqat, A., Hafsa, N., Monazza, K. (2011) The Greek Sovereign Debt Crisis: Antecedents, Consequences and Reforms Capacity,  Journal of Economics and Behavioural Studies,  2(6) [online]. Available at:  http://www.ifrnd.org/JEBS/2(6)%20June%202011/The%20Greek_Sovereign%20Debt%20Crisis.pdf 
11. Pastor, Manuel Jr. (1993) Managing the Latin American Debt Crisis: The International Monetary Fund and Beyond. Epstein, G., Graham, J., Nembhard, J. (ed) Creating a New World Economy: Forces of Change and Plans for Action.  Philadelphia: Temple University Press, pp 289-313.
12. Rhode, W. R. (1992) The Disaster that didn’t happen. The Economist; 324(7776), pp.21-23 [online]. Available at: Business Source Premier 
13. The causes: A very short history of the crisis (2011). The Economist. 400(8759) pp.5[online]. Available at: Business Source Premier 
14. Eurostat (2011) General government gross debt [online]. Available at: http://epp.eurostat.ec.europa.eu/tgm/table.do?tab=table&plugin=0&language=en&pcode=tsieb090
15. Skaperdas, S. and Olive, D. (2011) The Euro debt crisis: default or bailout? New Internationalist.  Available at: Business Source Premier
16. Margaronis, M. (2011) Greece in Debt, Eurozone in Crisis. Nation. 293 (3/4) Available at: Business Source Premier